

With four years of data, we are increasingly able to move beyond static disclosures and evaluate real-world progress. This is particularly relevant in the context of the Paris Agreement, which marked its 10th anniversary in December 2025. Many companies are now approaching their first meaningful decarbonisation milestones, providing a clearer basis on which to assess execution against ambition.
Recalibrating Ambition
Although many companies set bold early targets, historically, execution has often proven challenging. One global study found that over 70% of companies have fallen behind on initial targets, often reflecting early over-ambition and an underestimation of execution complexity2. Against this backdrop, it has been encouraging to review our portfolio holdings’ progress and see that the majority with targets are on course to reach their goals.
Cipla, however, is a good example of one that may have set the original bar too high. The Indian pharmaceutical company, with its large manufacturing footprint, set a demanding target to reach carbon neutrality for its domestic operations by the end of 2025. Even though it is likely to fall short of that goal, progress to date has been notable: Scope 1 and 2 emissions3 have declined by 58% since 2020, supported in part by increased adoption of solar power4.
Importantly, this shift towards renewable energy is already creating tangible cost savings, too. Cipla is reviewing its carbon targets, and we anticipate an updated, more realistic short-term target will be published in due course. Indeed, many of our companies have now moved on to 2030 targets, so we will track progress towards this next milestone in the coming years.
Diverging Disclosure
Sustainability reporting standards vary in both type and scope across the emerging markets universe5, which creates challenges when comparing one company with another. We are also seeing notable differences in the pace of improvement from country to country. For example, we have been pleasantly surprised by the seriousness with which some of our investments in China take sustainability reporting, and the detail they give. Understandably, companies with global brands, such as medical equipment manufacturer Shenzhen Mindray and home appliance maker Midea, have led the way. Both companies have set themselves realistic targets of reducing their Scope 1 and 2 emissions intensity by 2030.
Domestic-focused companies are catching up, as shown by Yifeng Pharmacy disclosing data that conforms with Global Reporting Initiative standards, although it has not yet set itself any climate-related goals.
In contrast, improvements in many Indian corporates have stalled since the introduction of mandatory business responsibility and sustainability reporting (BRSR) by the Indian stock exchange regulator in FY2023. The change forced companies to quickly up their game and report on various ESG metrics but also gave them plenty of scope to choose how they report. This has led to data comparability issues and some corporates providing the bare minimum to comply with the rules.
We encourage all companies in which we invest to improve their reporting standards but it’s in India, not China, where we need to nudge a little harder.
The Cost of Keeping Cool
For grocery retailers and other cold-chain-dependent businesses, refrigerants are often viewed as a relatively small operational consideration. However, their climate impact is disproportionately large. With global warming potentials (GWPs) thousands of times greater than CO₂, even modest leakages can dominate direct emissions, turning what appears to be a technical detail into a central decarbonisation challenge.
Poland-focused grocery retailer Jerónimo Martins provides a clear example of how a sustained, structured approach can deliver both environmental and financial outcomes. Since 2015, the company has systematically phased out high-GWP refrigerants in favour of natural alternatives such as carbon dioxide, ammonia and propane. Today, approximately 73% of its distribution centres and 64% of stores operate on low-GWP systems. This transition has been underpinned by €790 million of investment in energy-efficiency and lower-GWP technologies since 2017, generating an average payback period of around three years. In total, the programme has avoided approximately 1.25 million tonnes of emissions while also delivering tangible operating cost savings6. By contrast, Walmart de México remains at an earlier stage of this transition. Refrigerants currently account for close to half of its operational emissions, representing the single largest barrier to achieving its 2040 zero-emissions target. As such, the pace of technology deployment will be a key determinant of progress, and this is something we will continue to engage on.
The Multinational Advantage
Another clear theme emerging from our analysis is the extent to which companies embedded within multinational systems are progressing more rapidly than many locally controlled peers. Our Coca-Cola bottlers provide a strong illustration. They stand out not only for the depth of their emissions disclosure, but also for the breadth of reporting across material sustainability issues, including water stewardship, packaging and human rights. This is matched by tangible progress: they have already achieved meaningful reductions in operational emissions and exhibit some of the highest renewable energy penetration levels within the portfolio.
That said, operating in emerging markets continues to present structural challenges. This is evident in Heineken’s Indian subsidiary, United Breweries. Despite committing to a 2040 net zero target, the company has yet to fully map its Scope 3 emissions, reflecting the complexity and fragmentation of local supply chains.
Capture the FLAG?
Scope 37 has long been a point of contention for those predisposed to argue the finer details of accounting, yet its purpose has always been useful: to capture the full breadth of a company’s value chain impact. In recent years, we have seen more and more categories being added to the exhausting calculation, pushing companies to better articulate what sits within and beyond their direct control. Against this backdrop, the emergence of FLAG versus non-FLAG reporting marks a meaningful shift.
FLAG refers to Forestry, Land, and Agriculture. A few of the more progressive companies, particularly those who operate both in emerging and developed markets, have begun to make the distinction within their Scope 3 disclosures. In many ways, this parallels the market-based versus location-based distinction in Scope 2, highlighting that some aspects of the value chain are way out of their control. The hard reality is that transforming global value chains is not simple: roughly one-eighth of humanity works in FLAG-related sectors, overwhelmingly skewed to agriculture8. Ensuring small-scale farmers in India or Africa align with Paris Agreement targets is not easy.
Breaking out FLAG helps draw lines around the scale of this complex issue. Looking ahead, a key question will be whether this distinction becomes a tool for companies to alter their long-term targets. It is important we continue to monitor and engage with companies on how they are tackling this global challenge.
Where Climate Hits Capital
For financial institutions, climate exposure ultimately converges in Scope 3, Category 15: financed emissions. This is where the reckoning occurs, capturing the emissions generated by businesses enabled through bank lending.
Why does this matter? The growing damage from a warming planet is already creating both direct and indirect impacts. Directly, physical events are feeding through into asset quality.
For example, in the Philippines, it is estimated that for every 1% increase in storm damage caused by a typhoon, non-performing assets increase by 2.3%9. Indirectly, there is a rising risk of stranded assets.
As certain activities become uneconomic to finance, asset values can fall, leaving lenders exposed to impairments. This risk is not confined to large infrastructure projects. In Australia, for instance, it is estimated that 1 in 10 homes could become uninsurable by 203510. Such outcomes would effectively render properties unsellable, weakening collateral values and, in turn, bank loan books. There is also the possibility that a more latent indirect risk is building: legal liability for banks financing the largest emitters of carbon.
Against this backdrop, India remains a laggard on financed emissions disclosure. The country’s 2070 net zero target reflects, in part, its structural dependence on fossil fuels. Currently, only one bank – Yes Bank – fully reports financed emissions. HDFC Bank has begun a pilot with the Partnership for Carbon Accounting Financials (PCAF), and only a couple of peers are at early stages of disclosure11.
Among the 35 largest banks, only six have set net zero targets. Kotak stands out as one of just two banks to have conducted climate scenario analysis, assessing how a changing climate could impact its loan book12. As investors in Kotak and HDFC Bank, it is in our long-term interest to continue pushing for stronger disclosure and to think about risks to both assets and reputation.
Conclusion
Our bottom-up analysis continues to benefit from the improving depth and consistency of company reporting, but it also reinforces the importance of looking beyond disclosure alone. The most useful insights come from tracking whether targets are credible, whether progress is translating into operational change, and where structural challenges remain. Although performance is uneven across markets and sectors, the overall direction is encouraging: more companies are measuring what matters, setting clearer and more realistic objectives, and beginning to demonstrate delivery.
It is this progress that we believe will enable these companies to thrive in the future and support good long-term returns. We will continue to build on this work, using the evidence gathered to inform investment decisions, focus our stewardship priorities, and engage with companies where better disclosure, stronger execution or more credible pathways are still needed.
Table 1. – Emissions Analysis Summary
Skerryvore GEM Equity Strategies (Representative Portfolio) - Top 10 holdings by weight
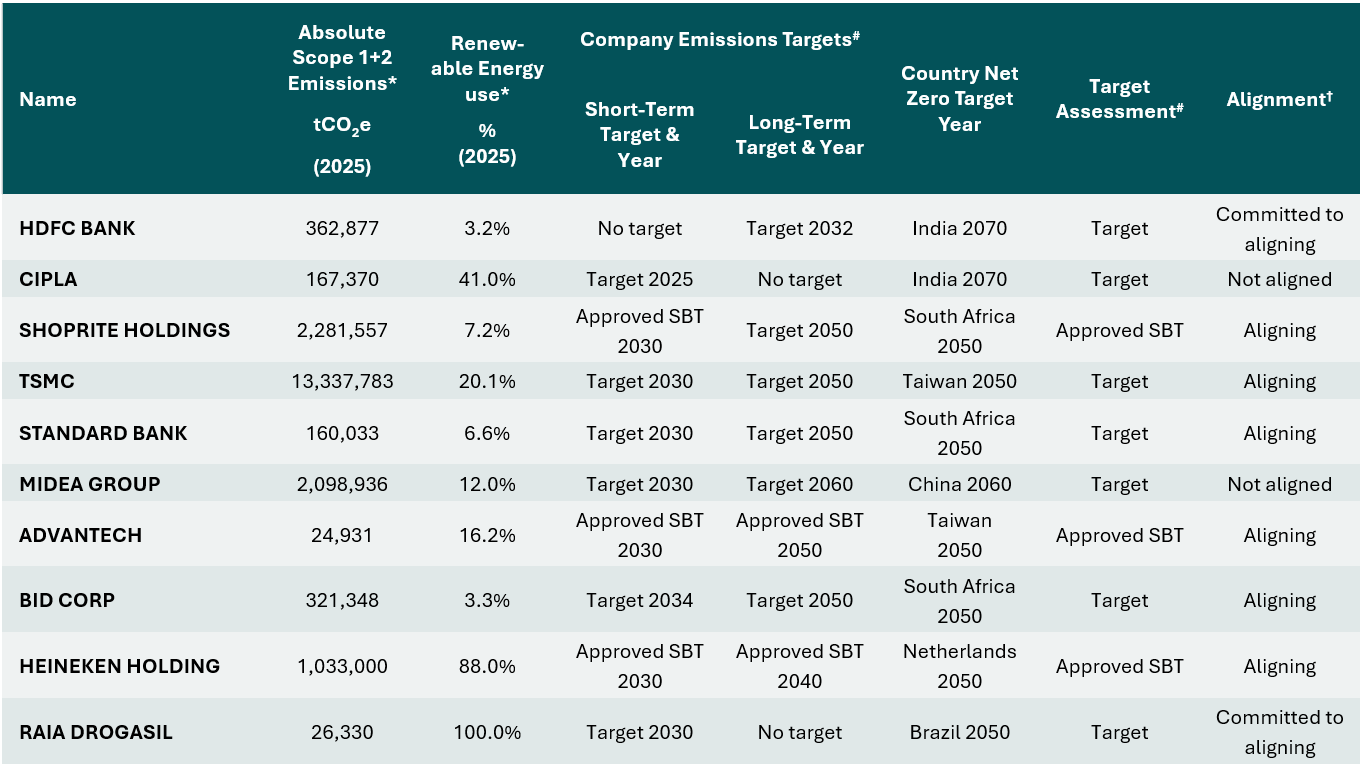 Source: Skerryvore. Using fiscal year end data available (in company sustainability reports and disclosures) as of 30 June 2026.
* Using all commercially reasonable efforts.
# Includes approved science-based target (SBT) / committed SBT / target / no target - in line with methodology (page 10)
† Includes aligned / aligning / committed to aligning / not aligned - in line with methodology (page 10)
1 See the ‘Considering Carbon Risk’ section of this document (page 9 and 10) for more detail.
2 Aldy, J.E., Bolton, P., Kacperczyk, M., & Halem, Z.M. Journal of Applied Corporate Finance (2023), 35(2) 26-34. Behind schedule: The corporate effort to fulfil climate obligations.
3 Scope 1 emissions are those that a company directly owns and controls; Scope 2 are indirect emissions from purchased energy.
4 Cipla Annual Report FY2024–25, p. 16.
5 See, for example, our 2023 article on ‘The data challenge’: www.skerryvoream.com/uk/insights/long-view/data-challenge and from 2022 ‘Raising the Standard’ www.skerryvoream.com/uk/insights/long-view/raising-standard.
6 Jeronimo Martins Climate Transition Plan (April 2026), pp. 16 and 25.
7 Scope 3 emissions are indirect emissions from a business’s supply chains. See our 2024 article, ‘Do you know your Scope 3 from your Scope 4?’ www.skerryvoream.com/uk/insights/long-view/do-you-know-your-scope-3-your-scope-4.
8 Food and Agriculture Organization (July 2025 update). Employment indicators 2000–2023 (July 2025 update); Skerryvore.
9 World Bank Blogs (18 April 2023). Banking sector risks in the aftermath of climate change and environmental-related disasters.
10 ABC News (14 January 2025). One in 10 homes could become uninsurable by 2035, analyst warns.
11 Climate Risk Horizons. (May 2026), p. 32. Small Steps for a Big Problem: Despite Climate Crisis, Indian Banks Stuck In Compliance Mode.
12 Climate Risk Horizons (December 2024), pp. 31 and 28. India's banks moving too slowly in face of climate crisis.